![]() |
Autonomy Software C++ 24.5.1
Welcome to the Autonomy Software repository of the Mars Rover Design Team (MRDT) at Missouri University of Science and Technology (Missouri S&T)! API reference contains the source code and other resources for the development of the autonomy software for our Mars rover. The Autonomy Software project aims to compete in the University Rover Challenge (URC) by demonstrating advanced autonomous capabilities and robust navigation algorithms.
|
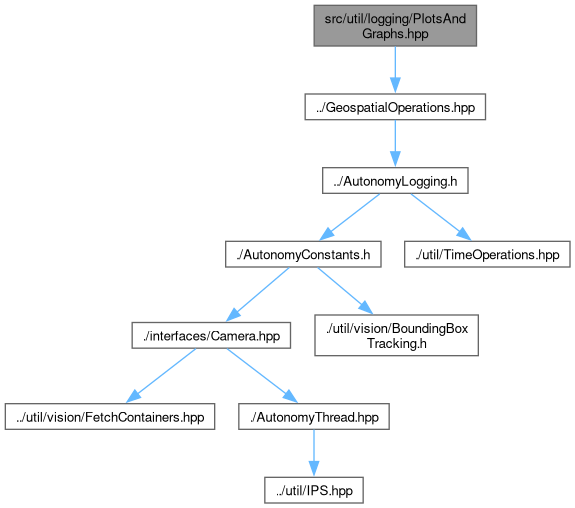
This file contains the implementation of useful utility functions for plotting and graphing certain data with matplotlib. More...
#include "../GeospatialOperations.hpp"
Go to the source code of this file.
Namespaces | |
namespace | logging |
Namespace containing all global type/structs that will be used project wide for logging. | |
namespace | logging::graphing |
Namespace containing all global type/structs that will be used project wide for graphing and plotting data with matplotlib. These graphing functions are built to be as feature rich as possible while still being easy to use. | |
Functions | |
void | logging::graphing::PlotCoordinates2D (const std::vector< geoops::UTMCoordinate > &vCoordinates, const std::string &szTitle="UTMCoordinatePlot") |
Plot a 2D graph of UTM coordinates. | |
void | logging::graphing::PlotCoordinates2D (const std::vector< geoops::GPSCoordinate > &vCoordinates, const std::string &szTitle="GPSCoordinatePlot") |
Plot a 2D graph of GPS coordinates. | |
void | logging::graphing::PlotCoordinates2D (const std::vector< geoops::Waypoint > &vWaypoints, const std::string &szTitle="WaypointPlot") |
Plot a 2D graph of waypoints. | |
void | logging::graphing::PlotCoordinates3D (const std::vector< geoops::UTMCoordinate > &vCoordinates, const std::string &szTitle="UTMCoordinatePlot") |
Plot a 3D graph of UTM coordinates. | |
void | logging::graphing::PlotCoordinates3D (const std::vector< geoops::GPSCoordinate > &vCoordinates, const std::string &szTitle="GPSCoordinatePlot") |
Plot a 3D graph of GPS coordinates. | |
void | logging::graphing::PlotCoordinates3D (const std::vector< geoops::Waypoint > &vWaypoints, const std::string &szTitle="WaypointPlot") |
Plot a 3D graph of waypoints. | |
This file contains the implementation of useful utility functions for plotting and graphing certain data with matplotlib.